Management accounting presented inunderstandablehumanaccessiblelanguage.
Management accounting presented inhumanaccessiblelanguage.
Agriculture is one of the most complex industries in terms of accounting and reporting, according to my mind, primarily for reporting.
Since the duration of the manufacturing cycle at the enterprise is almost a year (depending on the crops grown), it is possible to form a financial result only once a year (and therefore to draw up a profit & loss statement).
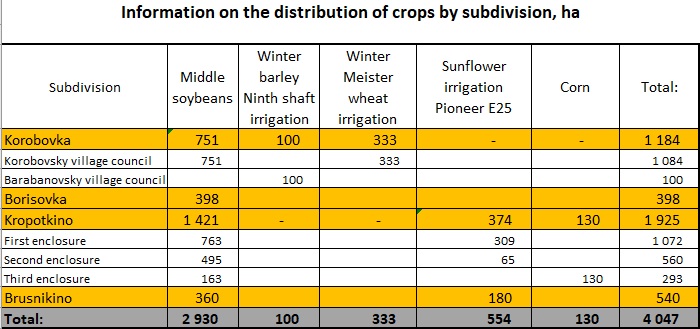
Agricultural enterprise planning begins with determining what and in which fields will be grown (“Areas” sheet). That means that a table is drawing up with a breakdown by crops and an indication of the planting acreage. This table can also be compiled in the context of subdivisions and different types of the same crops cultivars. Since, depending on the variety and place of seeding, the culture technique can be different.
Table № 1 “Crops”
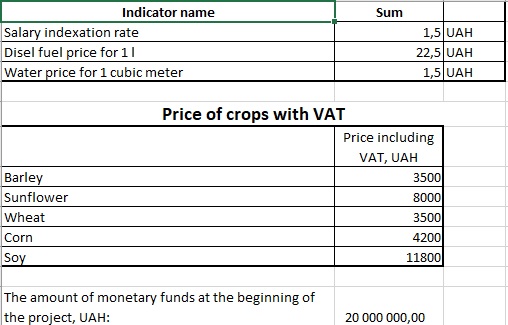
On the separate sheet “General indicators” we put out particular data for the calculation, which will be used on different calculation sheets. There is no point in describing these tables because of their simplicity.
After the crops and planting acreage are determined, one can proceed directly to drawing up an operation flow chart. The operation flow charts are placed on sheets with the name of the culture to which this chart belongs.
Table № 2 “The operation flow chart”
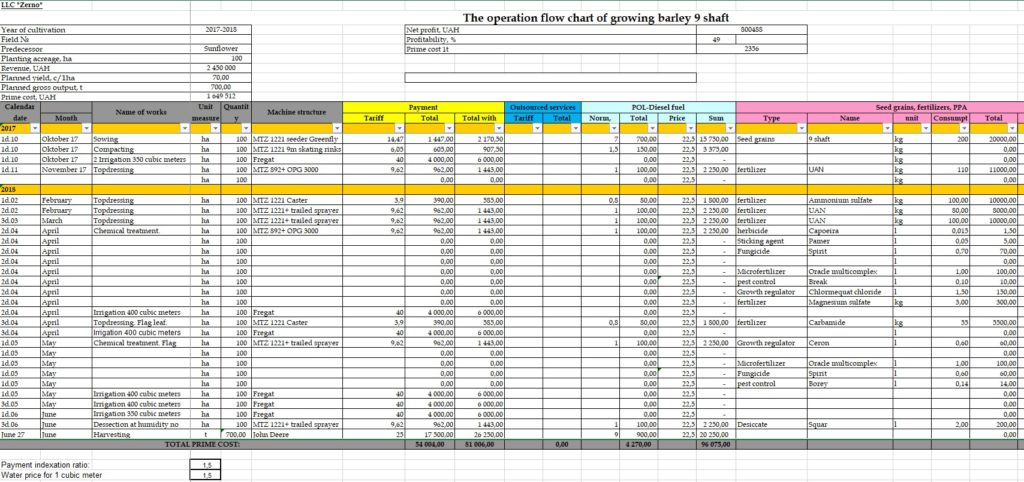
The operation flow chart consists of three tables. The first two small ones are at the top of the sheet.
The first table is a header with general information on the operation flow chart. Line by line:
| № Column | Name | Content | Notes |
| 1. | Calendar date | The terms of agricultural operations are indicated every ten days | |
| 2. | Month | The month of work is indicated | It to some extent duplicates the first column, but it is necessary for the subsequent automation of calculations. |
| 3. | Name of works | What kind of operation is being carried out | |
| 4. | Unit measure | Data units of measurement indicated in the column №3 | |
| 5. | Quantity | Quantity of units indicated in column №4. | Hectares, which are processed according to the operation flow chart, are written here. The amount of seeds/grain is indicated only in the operations “Seed treatment,” “Harvesting,” “Transportation.” |
| 6. | Machine structure | Indicated with which machine structure (tractor + trailer) | There may not be a tractor, but another self-moving mechanism |
| 7. | Block “Payment” “Tariff” | Workers` payment for processing one hectare | |
| 8. | Block “Payment” “Total” | Total wage amount for this operation in the specified growing area | Defined as the multiplication of columns 7 and 5 |
| 9. | Block “Payment” “Total with indexation” | The total amount of wages increased by the indexation coefficient. | Defined as the multiplication of column 8 on the indexation coefficient (indicated at the bottom of the main table). Why I enter the indexation coefficient will be explained later. |
| 10. | Block “Outsourced services” “Tariff” | Payment to the outsourced services for processing one hectare (or ton) | |
| 11. | Block “Outsourced services” “Total” | The total amount of payments to the outsourced services for this operation | Defined as the multiplication of columns 10 and 5 |
| 12. | Block “POL-Diesel fuel” “Norm, l/ha” | Consumption rate of diesel fuel per 1 ha | |
| 13. | Block “POL-Diesel fuel” “Total quantity, l” | Total quantity of diesel fuel for this operation | Defined as the multiplication of columns 12 and 5 |
| 14. | Block “POL-Diesel fuel” “Price UAH/l” | Fuel price | The fuel purchase price is set |
| 15. | Block “POL-Diesel fuel” “Sum, UAH” | Total expenses of POL in monetary terms for this operation | Defined as the multiplication of columns 14 and 13 |
| 16. | Block “Seed grains, fertilizers, PPA” “Type” | Used type of agricultural material | The group of agricultural material is indicated. For example: fertilizer |
| 17. | Block “Seed grains, fertilizers, PPA” “Name” | Name of of agricultural material | For example: ammonium saltpeter |
| 18. | Block “Seed grains, fertilizers, PPA” “Unit measure” | Unit measure | |
| 19. | Block “Seed grains, fertilizers, PPA” “Сonsumption rate” | Norm of consumption rate of agricultural material per 1 ha | |
| 20. | Block “Seed grains, fertilizers, PPA” “Quantity” | Total quantity of agricultural material used for this operation | Defined as the multiplication of columns 19 and 5 |
| 21. | Block “Seed grains, fertilizers, PPA” “Price” | Price of agricultural material | The price for materials is taken automatically from a separate table, where all prices for the used agricultural materials are collected |
| 22. | Block “Seed grains, fertilizers, PPA” “Sum” | The total cost of agricultural material for this operation | Defined as the multiplication of columns 21 and 20 |
| 23. | Block “Irrigation” “Price” | Irrigation price for 1 hectare of land including the cost of electricity | |
| 24. | Block “Irrigation” “Sum” | Total expenses of this operation | Defined as the multiplication of columns 23 and 5 |
The entire technological process for growing a particular crop is entered into the above table.
It should be noted that not all table cells in every line have to be filled in. Only the necessary data for business transactions is filled in.
Pay attention to the column №21 “Price.” This column contains the VLOOKUP formula, which selects from the “Price” table the price of the particular product indicated in the column №17. Doubtless, there is an opportunity to set prices manually and the table will calculate everything correctly. However, if there are a lot of operation flow charts, then you can be mistaken indicating the prices of the same product in different charts or forget to change the price of a product in some operation flow chart because of the change of price on the market.
The table for entering prices for agricultural materials is extremely simple:
Table №3 “Prices”
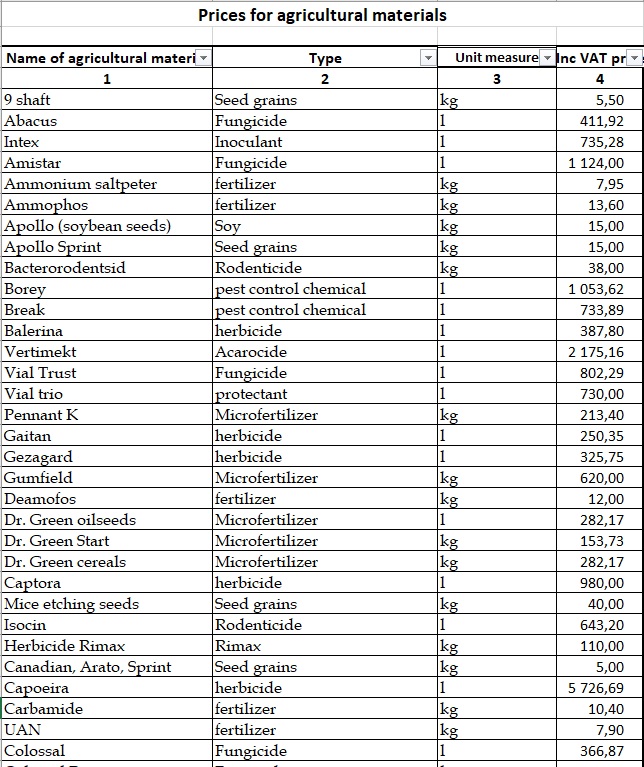
In the columns is entered the following data:
| № Column | Name | Content | Notes |
| 1 | Name of agricultural material | The name is indicated | |
| 2 | Type | Group of agricultural material is indicted | For example: PPA, fertilizers, etc. |
| 3 | Unit measure | In what units of measurement is agricultural material measured | Kilograms, liters |
| 4 | Price | Market price | At what price one can buy the product |
When the operation flow charts are finished for all grown crops, then appears a new challenge:
There is a necessity to consolidate this data into one table.
To do this, you will have to build a primary consolidation table, where all expenses will be collected by crop type. This table has two functions:
Table №4 “Crop costs”
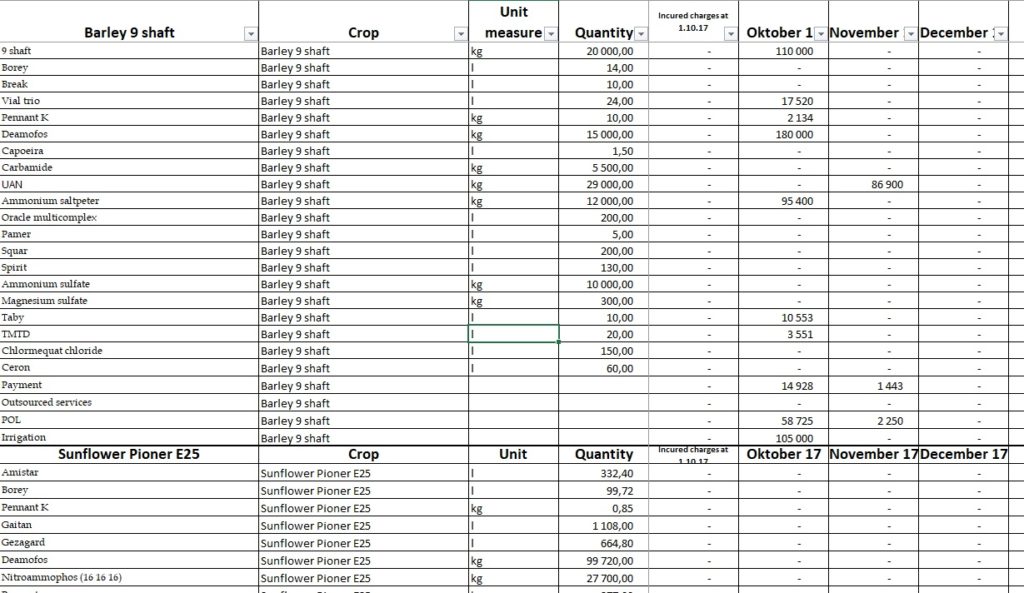
Pay attention that:
Let’s take a look at the content of each column.
| № Column | Name | Content | Notes |
| 1. | Name of agricultural material | Name of agricultural material used or type of expenditures | I recommend writing on each operation flow chart all products and fertilizers used in the season, regardless of whether they are used on a given crop or not. |
| 2. | Type | Type of used agricultural material | |
| 3. | Crop | The crop grew according to this operation flow chart. | In this column, throughout the entire block, only the name of the crop from the corresponding operation flow chart is indicated. |
| 4. | Unit measure | In what units of measurement is agricultural material measured | |
| 5. | Quantity | Quantity of used agricultural material in this operation flow chart. | |
| 6.-21. | Months | Costs in monetary terms for the used agricultural material or type of expenditures in the corresponding month | Data is taken directly from the operation flow chart using the SUMIFS formula. Summing, the formula compares two criteria: the name of the material/type of expenditures and the month the expenditure was incurred. |
| 22. | Total | Line cost amount |
Once again, I want to remind you that it is necessary to enter all operation flow charts separately in this table. There will be a separate block for each chart.
In addition to that, I recommend entering a complete list of the products and fertilizers used in each block (for each technological map), regardless of their usage in a specific operation flow.
After you have compiled a set of costs in the context of crops, the next step is to compile a total set of costs. In this table, the data is provided not for crops, but for the enterprise as a whole in the context of products, fertilizers, and types of expenditures.
Sheet “Total set of costs”
In fact, these are two tables. The total set of costs is formed on the basis of the previous table “Crop costs,” fixed costs are also written in this section (it means that costs are not directly related to the technological process).
Let’s take a look at these tables.
Table №5 Total set of costs by operation flow charts
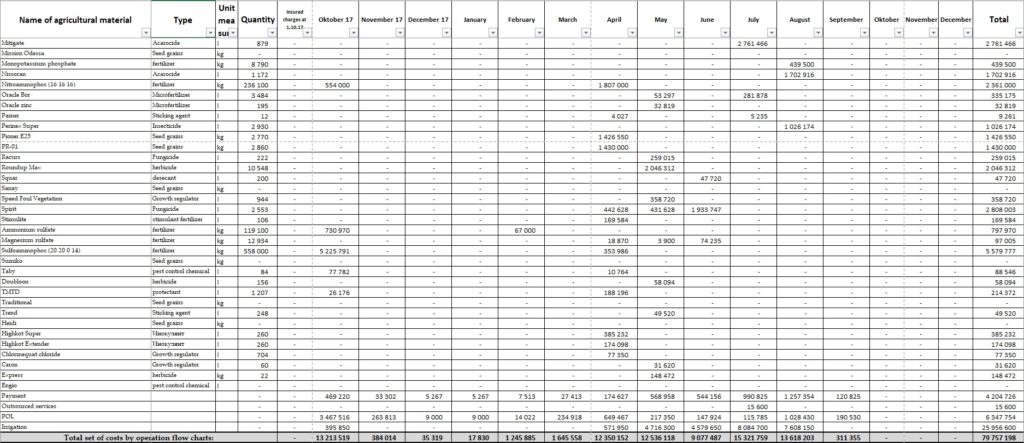
Let’s take a look the economic meaning of each column:
| № Column | Name | Content | Notes |
| 1. | Name of agricultural material | Name of agricultural material used or type of expenditures | All agricultural materials and types of expenditures are listed here, they are also indicated in the table “Crop costs” |
| 2. | Type | Type of used agricultural material | |
| 3. | Unit measure | In what units of measurement is agricultural material measured | |
| 4. | Quantity | Quantity of used agricultural material in this operation flow chart. | |
| 5.-20. | Months | Costs in monetary terms for the used agricultural material or type of expenditures in the corresponding month | Formed by the SUMIFS formula based on the data in Table 4 “Crop costs” |
| 21. | Total | Line cost amount |
Table №6 “Fixed costs”
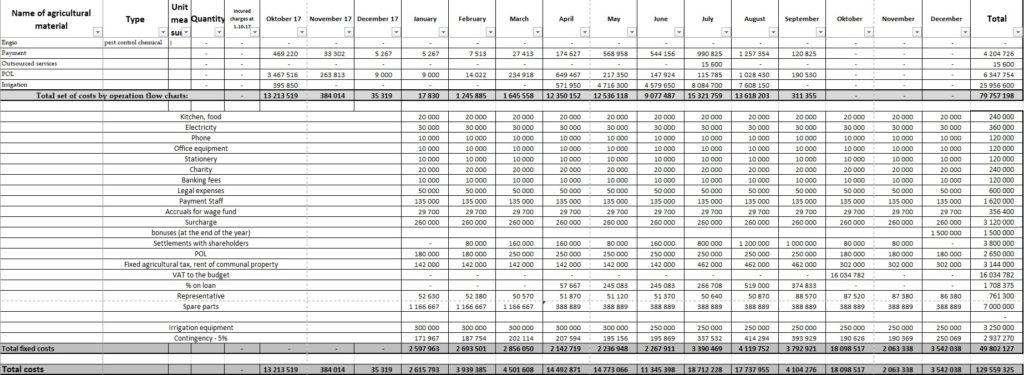
Costs that are not connected with the operation flow chart are calculated in this table.
The column data is the same as in the above table, but here columns 1, 9-21 are used.
There are columns 2-4 in the table, but they are not filled in. These columns are needed in the table because it is on the same sheet with the pivot table for technological expenses.
Columns 5-8 are empty because the fixed costs are for crops grown in the season of their origin. Thus, in the planned season it will be taken into account the fixed costs of the planned year, although the costs for operation flow charts appear in the previous season.
After pivoting these two tables, you will get the budget for the planned season. The total sum of costs is reflected in the line “Total costs.”
Pay attention, the monthly costs need to be considered in the formulas for the distribution of costs according to the operation flow chart. The column №2 “Month” is introduced in the chart for this purpose.
Then, after cost budget calculation, we determine the actual need for agricultural materials (plant protection agents, fertilizers, etc.). It is necessary to create a table “Warehouse” to do this.
Table №7 “Warehouse”
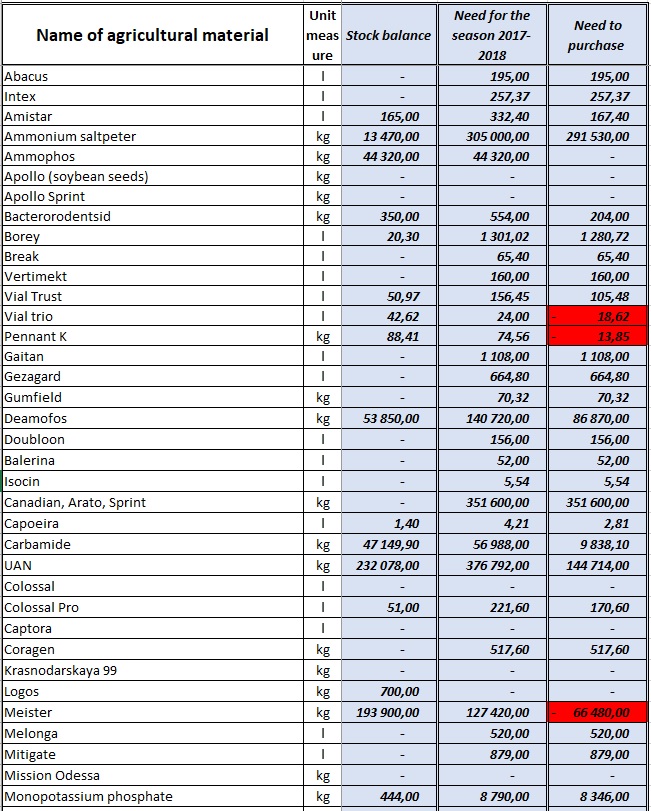
Economic content of columns:
| № column | Name | Content | Notes |
| 1. | Name of agricultural material | Name of agricultural material used or type of expenditures | |
| 2. | Unit measure | In what units of measurement is agricultural material measured | |
| 3. | Stock balance | Remaining material in stock at the beginning of the planned season | |
| 4. | Need for the season | Material requirement for the planned season according to the planned operation flow charts | |
| 5. | Need to purchase | The quantity of the material to be purchased | Calculated using the formula: column 4 – column 3 |
Pay attention, in the tables is used conditional formatting: when the quantity of material in the warehouse is greater than the demand for it for the season. The corresponding table cell in column 5 is colored in red.
After the calculation of the actual need for the purchase of agricultural materials, we can plan the cash flow.
Sheet “Cash flow”
The sheet “Cash flow” contains several tables that help to calculate the cash flow for each month.
Table № 8
This table calculates the procurement time of agricultural materials based on the time of demand.

Economic meaning of the above table columns:
| № Column | Name | Content | Notes |
| 1 | Name of agricultural material | Name of agricultural material used or type of expenditures | Data comes from the table “Warehouse” by direct links |
| 2 | Type | Type of used agricultural material | Data comes from the table “Warehouse” using the VLOOKUP formula. |
| 3 | Unit measure | In what units of measurement is agricultural material measured | Data comes from the table “Warehouse” using the VLOOKUP formula. |
| 4 | Quantity | The quantity of the material to be purchased | Data come from the table “Warehouse.” It means the purchase requirement is calculated by the availability of this product in the warehouse. The formulas IF (to remove negative values) and SUMIF are used. |
| 5 | Price, UAH | Purchase price of agricultural material | The price for materials is taken automatically from a separate table “Price,” where all prices for the used agricultural materials are collected. The VLOOKUP formula is used. |
| 6 | Sum, UAH | Required sum for purchase of required quantity | The formula is column 4 * column 5 |
| 7-21 | Months | Costs in monetary terms collected from the table “Total set of costs” | The formula IF (in order not to take into account the costs provided by the stock balances) and SUMIF are used. |
| 22 | Total | Line cost amount |
In the 7th column, the formula is put (an example of a formula from the first table cell of the column is given): IF((‘Total set of costs’!$U2-CF!$F5)>=SUM(‘Total set of costs’!$F2:’Total set of costs’!F2);0;((SUM(‘Total set of costs’!$F2:’Total set of costs’!F2))-(‘Total set of costs’!$U2-CF!$F5)))
In the columns 8-21 is used the formula (again, example of the formula is from the first table cell in the column): IF(SUM(SUM($G5:G5);’Total set of costs’!$U2-CF!$F5)>=’Total set of costs’!$U2;0;IF((‘Total set of costs’!$U2-CF!$F5)>=SUM(‘Total set of costs’!$F2:’Total set of costs’!G2);0;((SUM(‘Total set of costs’!$F2:’Total set of costs’!G2))-(SUM($G5:G5;’Total set of costs’!$U2-CF!$F5)))))
I understand that the formulas look heavy and it is rather difficult to understand them without an example in the table. I give their examples to understand at least in general what formulas are used in the tables on the CF (cash flow) page.
The above formulas are used in those table lines where the purchase data of agricultural materials is calculated
In the last four lines of the table, where according to the operation flow chart data on the material consumption on wages, POL, products, Irrigation, and outsourced services are calculated, the formula is much simpler:
SUMIF(‘Total set of costs’!$A$2:$A$74;CF!$A73;’Total set of costs’!F$2:F$74)
This formula is taken from the line “Payment” and the column “October 17.”
If you are going to buy agricultural materials not as needed, but, for example, in advance or postpone the payment period for after the crop harvesting, then it will be necessary to transfer the amounts of necessary payments manually right on top of the formulas by entering data in particular table cells and deleting data from other cells. Try to remember to check that the total cost per month (from column 22) is equal to the total cost of purchasing agricultural material (from column 6).
Below is a table of cash flow for fixed costs, where fixed costs are indicated on a monthly basis.
Table №9 “Cash flow for fixed costs”
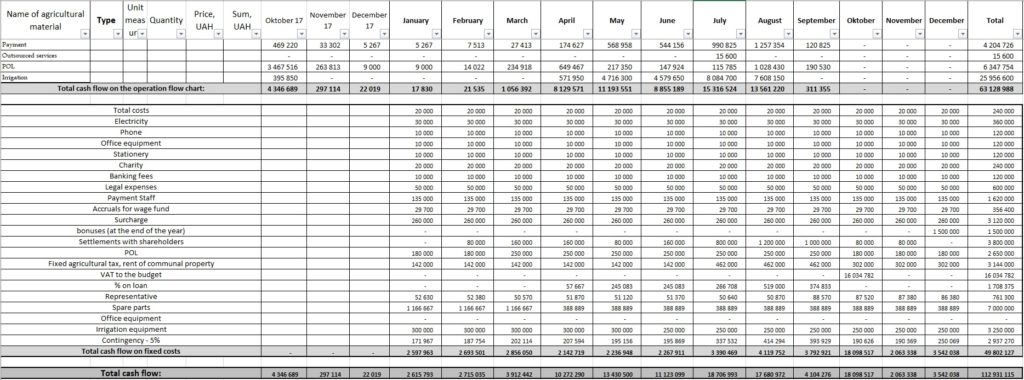
In other words, that is a complete copy of the fixed costs table from the “Total set of costs” sheet. Note, that fixed costs could vary on the time of occurrence upon payment, but to simplify the calculation, we accept that they arise and are paid in the same period. The resulting defect is not large.
The next line is “Total cash flow.” Here we summarize the results of the above two tables.
Next is a table where the income from the sale of grown crops is planned.
Table № 10 “Cash flow from sales”
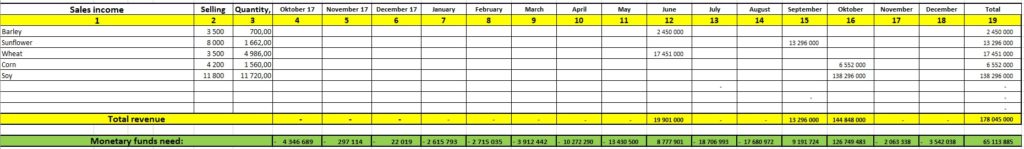
| № Column | Name | Content | Notes |
| 1 | Name of the crop | Name of the grown crop | |
| 2 | Selling price, UAH | Harvest selling price | |
| 3 | Quantity, t | Quantity of products for sale | |
| 4-18 | Months | The time of sale of the crop is indicated. | In the sales month, manually enter the formula: column 2 * column 3 |
| 19 | Total | Amount per line |
The line “Monetary funds need” is shown in green. Data in this line is determined by the formula: from the table cell of the “Total revenue” line subtract the corresponding table cell of the “Total cash flow” line.
Next table is “Cash flow from financing activities.“
Table № 11 “Cash flow from financial activities”
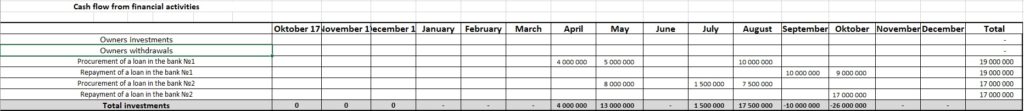
Data on investments and withdrawals of business owners, as well as procurement and repayment of loans from banks, are indicated. The total for the table is calculated as the difference between the lines “Investments” and “Withdrawals,” “Procurement of a loan” and “Repayment of a loan” in the line “Total investments/withdrawals”.
Now It remains to make the last step: to calculate the occurrence of cash shortage in the process of fulfilling of the planned.

The next formulas are mentioned in the last two lines to do this:
The line “Cash balance at the beginning of the period”: the balance of funds at the beginning of the planning period is entered manually in the first line cell (or from the sheet “General indicators”), then there is a link to the line “Cash balance at the end of the period” from the previous column. Thus, the cash balance at the end of the period will always be equal to the cash balance at the beginning of the next period.
The line “Cash balance at the end of the period”. In each table cell of the line we enter the following formula:
“Cash balance at the beginning of the period” – “Total cash flow” + “Total revenue” + “Total investments/withdrawals.”
For the above formula, table cells by the columns of the corresponding periods are summed. That is all about the “CF” sheet.
Sheet “Finances”
Tables №12, 13, 14
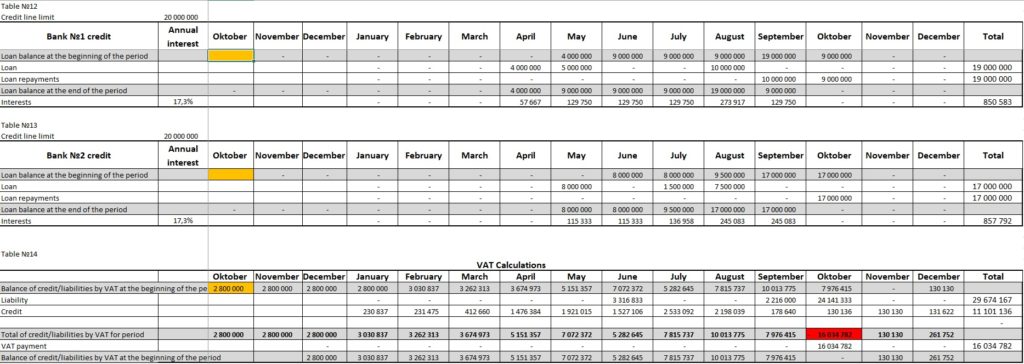
Tables №12 and 13 are tables for calculating interest on the use of credit lines. The tables manually indicate only: credit line limit, annual interest, credit line debt at the beginning of the period (indicated in an orange table cell). Other data in these tables are calculated automatically. Data on procurement and repayment of loans are taken from table №11 “Cash flow from financial activities” on the sheet “CF.” The sums of the calculated interest are included in the fixed costs of the enterprise on the sheet “Total set of costs.”
Table №14 is the calculation of added value tax (the tax rate is 20%). The sum of VAT liabilities arising on the sale of products and the amount of VAT credit arising as a result of purchases are calculated here.
The resulting excess of liabilities over loans gets into the fixed costs on the sheet “Total set of costs.”
You should understand the amount of the loan for VAT is calculated approximately, since it is impossible accurately to plan how much of the incurred expenses will be incurred by the VAT payers. Doubtless, there are payments for which their recipients are VAT payers (we know that for sure), but there are cost items for which only part of the payments will maintain a VAT credit.
Sheet “Profit & loss account”
The final sheet, where the financial result of the company’s activities in the planned season is formed.
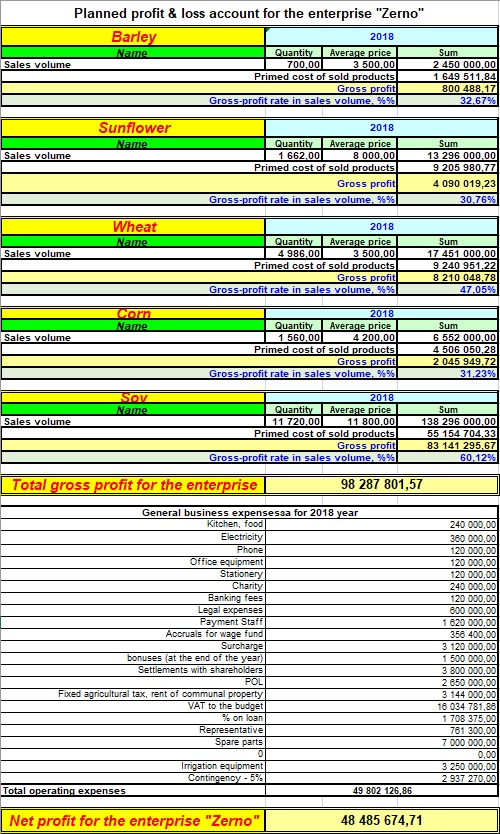
The report is divided into two parts: revenue and expenditure.
The revenue part consists of tables for each crop that is grown in the planned season. Each crop table contains data:
The total of the income part is formed in the line “Total gross profit for the enterprise.” It is determined as the sum of the lines of gross profit for each crop.
The expenditure part consists of a line item listing of fixed costs. This data is from table №9 “Cash flow for fixed costs.”
The total of the expenditure side is formed in the line “Total of operating expenses” and determined as the sum of all fixed expenses.
The sum total of the report is formed in the line “Net profit for the enterprise” and determined as the difference between the totals of the income and expenditure side.
By the means of the described in this article calculations, you will be able to combine all the operational flow charts for the grown crops, data on the sowing area in the context of crops, data on the procurement time of the necessary products and fertilizers, cash shortage, and the possible ways of its elimination. In addition to that, you will see a guaranteed financial result with the planned crop rotation and used sowing technology.
