Management accounting presented inunderstandablehumanaccessiblelanguage.
Management accounting presented inhumanaccessiblelanguage.
Main financial statement showing the management accounting system and financial position of the enterprise for the accounting period.
Balance sheet has three functions:
Now, let’s have a closer look:
If your accounts are balanced (that is assets equal to liabilities), it means that all the operations had been posted correctly and there are no mistakes in calculations or those
made through lack of attention (i.e. the goods have been shipped, but the debt has not been increased). So, the given balance sheet guarantees that there are no mistakes in posting the data, but it cannot guarantee that the posted data is correct.
In other words, if you use the incorrect information while posting the data (for example, according to the documents100 tons have been shipped, but actually 105 tons have been shipped), you will not notice the mistake at the end of the reporting period. It will become obvious while drawing up the inventory (it rarely happens when the Buyer reports about the extra goods), but this mistake is not connected with the accounting, it is the fault of the warehouse workers who will reimburse the losses.
If balance sheet is drawn up correctly, it contains the information about the assets of your company as well as its debts. There are a lot of forms of balance sheet, but they have almost the similar structure as it is hardly possible to invent something new.
That’s why I will describe two forms:
1) vertical,
2) horizontal.
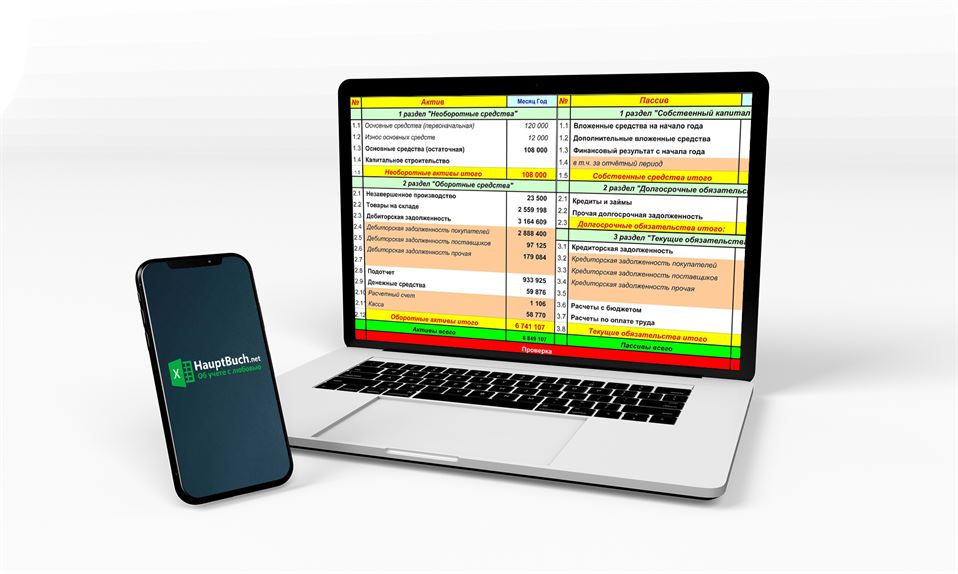
Vertical balance sheet:
|
Assets |
Month Year |
Liabilities |
Month Year |
||
|
Section 1 «Non-current assets» |
Section 1«Owner’s equity |
||||
|
1.1 |
Fixed |
120 |
1.1 |
Investments |
2 835 197 |
|
1.2 |
Depreciation |
12 |
1.2 |
Additional |
|
|
1.3 |
Fixed assets (net assets value) |
108 000 |
1.3 |
Income |
12 000 |
|
1.4 |
Capital construction |
1.4 |
including |
12 000 |
|
|
1.5 |
Total non-current assets |
108 000 |
1.5 |
Total owner’s |
2 847 197 |
|
Section 2 «Current assets» |
Section 2 «Long-term liabilities» |
||||
|
2.1 |
Work-in-process |
23 500 |
2.1 |
Credits and loans |
|
|
2.2 |
Merchandise |
2 559 198 |
2.2 |
Other long-term liabilities |
|
|
2.3 |
Accounts receivable |
3 164 609 |
2.3 |
Total long-term |
– |
|
2.4 |
Accounts receivable (buyers) |
2 888 400 |
Section 3«Current liabilities» |
||
|
2.5 |
Accounts receivable (suppliers) |
97 125 |
3.1 |
Accounts |
3 824 478,89 |
|
2.6 |
Accounts receivable (other) |
179 084 |
3.2 |
Accounts |
254 612 |
|
2.7 |
3.3 |
Accounts |
3 288 694 |
||
|
2.8 |
Petty cash |
933 925 |
3.4 |
Accounts |
281 173 |
|
2.9 |
Cash assets |
59 876 |
3.5 |
||
|
2.10 |
Settlement account |
1 106 |
3.6 |
Taxes |
25 000 |
|
2.11 |
Cash |
58 770 |
3.7 |
Wages |
152 431 |
|
2.12 |
Total current assets |
6 741 107 |
3.8 |
Total current |
4 001 910 |
|
Total assets |
6 849 107 |
Total liabilities |
6 849 107 |
||
|
Verification |
– |
||||
So, it has a typical form with 5 sections:
Sections are given in accordance with the increased liquidity, from top to bottom. The lines in orange color include the detailed interpretation of the line given. It is necessary to give more information about the line 1.4 in Liabilities. «Income statement from the beginning of the year is the accumulated sum of money which is calculated by means of adding the given line from the previous month with the income received in the accounting month (line 1.5).
The bottom red line is verifying, if there are some figures it means that the assets do not equal to the liabilities.
Horizontal balance sheet:
|
January 11 |
February 11 |
March 11 |
||
|
1.1 |
Fixed assets (original cost) |
120 000 |
120 000 |
120 000 |
|
1.2 |
Depreciation |
12 000 |
13 000 |
14 000 |
|
1.3 |
Fixed assets (net assets value) |
108 000 |
107 000 |
106 000 |
|
1.4 |
Capital construction |
|||
|
1.5 |
Total non-current assets |
108 |
107 |
106 000 |
|
2.1 |
Work-in-process inventory |
23 500 |
22 385 |
25 120 |
|
2.2 |
Merchandise |
2 559 198 |
2 852 000 |
2 700 123 |
|
2.3 |
Accounts receivable |
3 164 609 |
4 165 720 |
4 166 831 |
|
2.4 |
Accounts receivable (buyers) |
2 888 400 |
3 888 932 |
3 889 464 |
|
2.5 |
Accounts receivable (suppliers) |
97 125 |
97 808 |
98 491 |
|
2.6 |
Accounts receivable (other) |
179 084 |
178 980 |
178 876 |
|
2.7 |
||||
|
2.8 |
Petty cash |
933 925 |
928 061 |
922 197 |
|
2.9 |
Cash assets |
59 876 |
77 325 |
53 279 |
|
2.10 |
Settlement account |
1 106 |
15 001 |
14 856 |
|
2.11 |
Cash |
58 770 |
62 324 |
38 423 |
|
2.12 |
Total current assets |
6 741 107 |
7 117 460 |
6 945 353 |
|
Total assets |
6 849 107 |
7 224 430 |
7 051 353 |
|
|
1.1 |
Investments |
2 835 197 |
2 835 197 |
2 835 197 |
|
1.2 |
Additional |
|||
|
1.3 |
Income |
12 000 |
61 397 |
149 072 |
|
1.4 |
including |
12 000 |
49 397 |
87 675 |
|
1.5 |
Total owner’s |
2 847 197 |
2 896 594 |
2 984 269 |
|
2.1 |
Credits and loans |
|||
|
2.2 |
Other long-term liabilities |
|||
|
2.3 |
Total long-term |
– |
– |
– |
|
3.1 |
Accounts |
3 824 478,89 |
4 126 009 |
3 887 539 |
|
3.2 |
Accounts |
254 612 |
257 148 |
259 684 |
|
3.3 |
Accounts |
3 288 694 |
3 587 126 |
3 325 558 |
|
3.4 |
Accounts |
281 173 |
281 735 |
302 297 |
|
3.5 |
||||
|
3.6 |
Taxes |
25 000 |
48 523 |
25 368 |
|
3.7 |
Wages |
152 431 |
153 304 |
154 177 |
|
3.8 |
Total current |
4 001 910 |
4 327 836 |
4 067 084 |
|
Total liabilities |
6 849 107 |
7 224 430 |
7 051 353 |
|
|
Verification |
– |
– |
– |
It fact, this type of balance sheet contains the same sections if compare with the previous one (they cannot differ!), but it has another structure. Advantages: dynamic changes within the year are clearly seen. Disadvantages: general balance sheet structure as well as assets and liabilities correlation are not properly demonstrated. But this opinion is mine. So, while choosing the forms you can take the second option. But if the first type is used, the second one will be necessary to show the dynamics. To conclude, it is impossible to construct statements without the second (horizontal) type, but possible without the first (vertical) type.
Economists can use all possible analytical tools only due to the balance sheet.
As a rule, there are two ways how to make analysis:
It seems to me that analysis of item changing dynamics is easy to understand, you choose the line and observe the changes within the accounting period (3, 6, 12 months and etc.). So, while consideration you have to take into account not only the balance sheet, but also profit and loss account (we will study it later). For example, the dynamics of the accounts receivable and the merchandise output.
Analysis of financial performance has been described here.
If you need the above balance sheet in Excel, do not hesitate to contact me. I will send it to you.
